This article will be the first part of a miniseries on building a project cost-duration graph. The graph, as you will see in the next part, will provide you with insights into how you can compare additional cost alternatives (indirect or direct costs) for benefits and make the best decision available to you. You will find the link to the next part in the last paragraph of the post.
Nothing on the horizon suggests that the need to shorten project time will change.
In fact, if anything the pressure to get projects done quicker and sooner is likely to increase in importance. The challenge for the project manager is to use a quick, logical method to compare the benefits of reducing project time with the cost. When sound, logical methods are absent, it is difficult to isolate those activities that will have the greatest impact on reducing project time at least cost.
This article describes a procedure for identifying the costs of reducing project time so that comparisons can be made with the benefits of getting the project completed sooner.
The method requires gathering direct and indirect costs for specific project durations. Critical activities are searched to find the lowest direct-cost activities that will shorten the project duration. Total cost for specific project durations are computed and then compared with the benefits of reducing project time—before the project begins or while it is in progress.
Explanation of Project Costs
The general nature of project costs is illustrated in the figure below, Project Cost—Duration Graph.
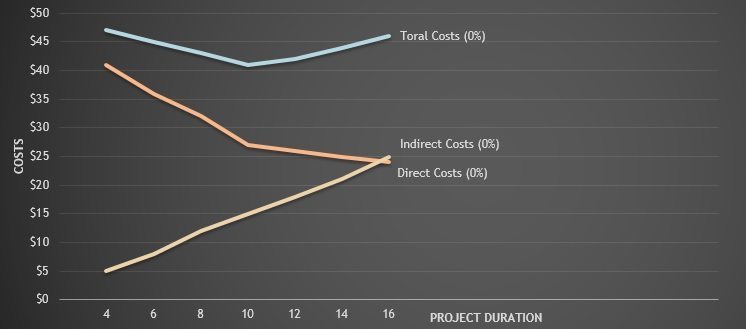
- The total cost for each duration is the sum of the indirect and direct costs.
- Indirect costs continue for the life of the project.
- Hence, any reduction in project duration means a reduction in indirect costs.
- Direct costs on the graph grow at an increasing rate as the project duration is reduced from its original planned duration.
With the information from a graph such as this for a project, managers can quickly judge any alternative such as meeting a time-to-market deadline.
Further discussion of indirect and direct costs is necessary before demonstrating a procedure for developing the information for a graph similar to the one depicted in the figure above.
Project Indirect Costs
Indirect costs generally represent overhead costs such as supervision, administration, consultants, and interest. Indirect costs cannot be associated with any particular work package or activity, hence the term. Indirect costs vary directly with time. That is any action in time should result in a reduction of indirect costs.
For example, if the daily costs of supervision, administration, and consultants are $2,000, any reduction in project duration would represent a savings of $2,000 per day.
If indirect costs are a significant percentage of total project costs, reductions in project time can represent very real savings (assuming the indirect resources can be utilized elsewhere).
Project Direct Costs
Direct costs commonly represent labor, materials, equipment, and sometimes subcontractors. Direct costs are assigned directly to a work package and activity, hence the term. The ideal assumption is that direct costs for an activity time represent normal costs, which typically mean low-cost, efficient methods for a normal time.
When project durations are imposed, direct costs may no longer represent low-cost, efficient methods. Costs for the imposed duration date will be higher than for a project duration developed from ideal normal times for activities. Because direct costs are assumed to be developed from normal methods and time, any reduction in activity time should add to the costs of the activity. The sum of the costs of all the work packages or activities represents the total direct costs for the project.
The major plight faced in creating the information for a graph similar to the figure above is computing the direct cost of shortening individual critical activities and then finding the total direct cost for each project duration as project time is compressed; the process requires selecting those critical activities that cost the least to shorten.
(Note: The graph implies that there is always an optimum cost-time point. This is only true if shortening a schedule has incremental indirect cost savings exceeding the incremental direct cost incurred. However, in practice there are almost always several activities in which the direct costs of shortening are less than the indirect costs.)
A discussion on direct and indirect costs was necessary so that the next part of the article will be easier to understand. You can find it here.
Image courtesy of Freepik.