Since estimating efforts cost money, the time and detail devoted to estimating is an important decision. Yet, when bottom up or top down estimates are considered, you as a project manager may hear statements such as these:
- Rough order of magnitude is good enough. Spending time on detailed estimating wastes money.
- Time is everything; our survival depends on getting there first! Time and cost accuracy is not an issue.
- The project is internal. We don’t need to worry about cost.
- The project is so small, we don’t need to bother with estimates, Just do it.
- We were burned once. I want a detailed estimates of every task by the people responsible.
- However, there are sound reasons for using top down or bottom up estimates.
The table below depicts conditions that suggest when one approach is preferred over another.
| Condition | Top Down |
Bottom Up |
| Strategic decision-making | Yes | |
| Cost and time important | Yes | |
| High uncertainty | Yes | |
| Internal, small project | Yes | |
| Fixed price contract | Yes | |
| Customer wants details | Yes | |
| Unstable scope | Yes |
Top Down Estimates Overview
Top Down estimates usually are derived from someone who uses experience and/or information to determine the project duration and total cost. These estimates are sometimes made by top managers who have very little knowledge of the processes used to complete the project.
For example, a mayor of a major city making a speech noted that a new law building would be constructed at a cost of $23 million and would be ready for occupancy in two and one-half years. Although the mayor probably asked for an estimate from someone, the estimate could have come from a luncheon meeting with a local contractor who wrote an estimate (guesstimate) on a napkin.
This is an extreme example, but in a relative sense this scenario is frequently played out in practice.
- Do these estimates represent low-cost, efficient methods?
- Do the top down estimates of project time and cost become a self-fulfilling prophecy in terms of setting time and cost parameters?
If possible and practical, you want to push the estimating process down to the work package level for bottom-up estimates that establish low-cost, efficient methods. This process can take place after the project has been defined in detail. Good sense suggests project estimates should come from the people most knowledgeable about the estimate needed. The use of several people with relevant experience with the task can improve the time and cost estimate.
Top Down Estimates, most used methods.
At the strategic level top down estimates are used to evaluate the project proposal. Sometimes much of the information needed to derive accurate time and cost estimates is not available in the initial phase of the project—for example, design is not finalized. In these situations top down estimates are used until the tasks in the WBS are clearly defined.
Consensus Methods
This method simply uses the pooled experience of senior and/or middle managers to estimate the total project duration and cost. This typically involves a meeting where experts discuss, argue, and ultimately reach a decision as to their best guess estimate. Firms seeking greater rigor will use the Delphi Method to make these macro estimates.
It is important to recognize that these first top down estimates are only a rough cut and typically occur in the “conceptual” stage of the project. The top down estimates are helpful in initial development of a complete plan. However such estimates are sometimes significantly off the mark because little detailed information is gathered. At this level individual work items are not identified. Or in a few cases, the top down estimates are not realistic because top management “wants the project.”
Nevertheless, the initial top down estimates are helpful in determining whether the project warrants more formal planning, which would include more detailed estimates. Be careful that macro estimates made by senior managers are not dictated to lower level managers who might feel compelled to accept the estimates even if they believe resources are inadequate.
Although I prefer to avoid the top down approach if possible, I have witnessed surprising accuracy in estimating project duration and cost in isolated cases.
Some examples are building a manufacturing plant, building a distribution warehouse, developing air control for skyscraper buildings, and road construction.
However, I have also witnessed some horrendous miscalculations, usually in areas where the technology is new and unproven.
Top Down estimates can be useful if experience and judgement have been accurate in the past.
Ratio Methods
Top Down estimates (sometimes called parametric) usually use ratios, or surrogates, to estimate project times or costs. Top Down estimates are often used in the concept or “need” phase of a project to get an initial duration and cost estimate for the project.
For example, contractors frequently use number of square feet to estimate the cost and time to build a house; that is, a house of 2,700 square feet might cost $160 per square foot (2,700 feet X $160 per foot equals $432,000). Likewise, knowing the square feet and dollars per square foot, experience suggests it should take approximately 10 days to complete.
Two other common examples of top down estimates are the cost for a new plant estimated by capacity size, or a software product estimated by features and complexity.
Apportion Methods
This method is an extension to the ratio method, apportionment is used when projects closely follow past projects in features and costs. Given good historical data, estimates can be made quickly with little effort and reasonable accuracy.
This method is very common in projects that are relatively standard but have some small variation or customization. Anyone who has borrowed money from a bank to build a house has been exposed to this process. Given an estimated total cost for the house, banks and the Housing Authority authorize pay to the contractor by completion of specific segments of the house.
For example, foundation might represent 3 percent of the total loan, framing 25 percent, electric, plumbing and heating 15 percent, etc. Payments are made as these items are completed.
An analogous process is used by some companies that apportion costs to deliverables in the WBS (Work Breakdown Structure)—given average cost percentages from past projects. The figure below presents an example similar to one found in practice.
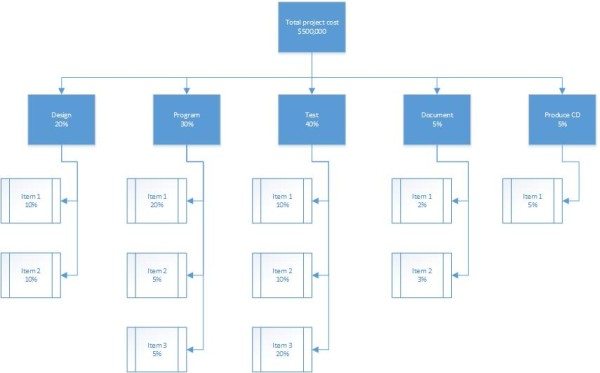
Assuming the total project cost is estimated, using a top down estimate, to be $500,000, the costs are apportioned as a percentage of the total cost. For example, the costs apportioned to the “Document” deliverable are 5 percent of the total, or The sub-deliverables “Doc 1 and Doc-2” are allocated 2 and 3 percent of the total—S10,000 and $15,000, respectively.
Function Point Methods for Software and System Projects
In the software industry, software development projects are frequently estimated using weighted macro variables called “function points” or major parameters such as number of inputs, number of outputs, number of inquiries, number of data files, and number of interfaces. These weighted variables are adjusted for a complexity factor and added. The total adjusted count provides the basis for estimating the labor effort and cost for a project (usually using a regression formula derived from data of past projects). This latter method assumes adequate historical data by type of software project for the industry—for example, MIS Systems uses them.
In the U.S. software industry, one-person month represents on average five function points. A person working one month can generate on average (across all types of software projects) about five function points. Of course each organization needs to develop its own average for its specific type of work. Such historical data provide a basis for estimating the project duration. Variations of this top down approach are used by companies such as IBM, Bank of America, Sears Roebuck, HP, AT&T, Ford Motors, GE, DuPont and many others.
See the tables below for a simplified example of function point count methodology.
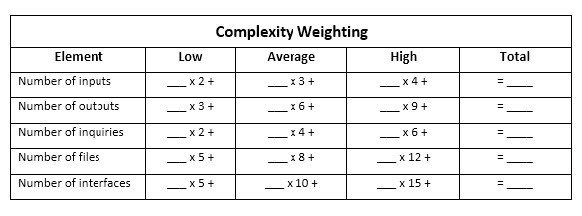
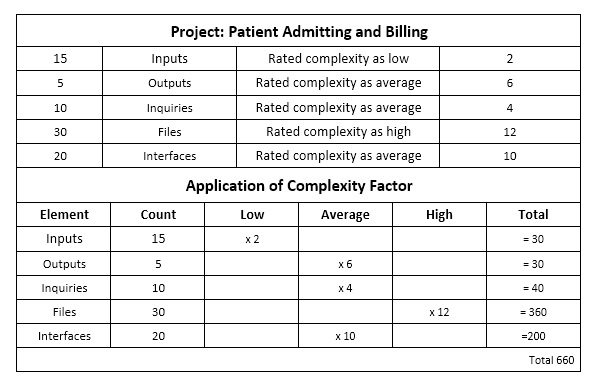
From historical data the organization developed the weighting scheme for complexity found in Table 1. Function points are derived from multiplying the number of kinds of elements by weighted complexity. Table 2 shows the data collected for a specific task or deliverable: Patient Admitting and Billing—the number of inputs, outputs, inquiries, files, and interfaces along with the expected complexity rating. Finally, the application of the element count is applied and the function point count total is 660.
Given this count and the fact that one-person month has historically been equal to 5 function points, the job will require 132 person months (660/5 = 132). Assuming you have 10 programmers who can work on this task, the duration would be approximately 13 months. The cost is easily derived by multiplying the labor rate per month times 132 person months. For example if the monthly programmer rate is $4,000 then the estimated cost would be $528,000 (132 X 4,000).
Although function point their accuracy depends on adequate historical data, currency of data, and relevancy of the project/deliverable to past averages.
Learning Curves
Some projects require that the same task, group of tasks, or product be repealed several times. Managers know intuitively that the time to perform a task improves with repetition. This phenomenon is especially true of tasks that are labor intensive. In these circumstances the pattern of improvement phenomenon can be used to predict the reduction in time to perform the task. From empirical evidence across all industries, the pattern of this improvement has been quantified in the learning curve (also known as improvement curve, experience curve, and industrial progress curve), which is described by the following relationship:
Each time the output quantity doubles, the unit labor hours are reduced at a constant rate.
In practice the improvement ratio may vary from 60 percent, representing very large improvement, to 100 percent, representing no improvement at all. Generally, as the difficulty of the work decreases the expected improvement also decreases and the improvement ratio that is used becomes greater. One significant factor to consider is the proportion of labor in the task in relation to machine-paced work. Obviously, a lower percentage of improvement can occur only in operations with high labor content.
The main disadvantage of top down estimates is simply that the time and cost for a specific task are not considered. Grouping many tasks into a common basket encourages errors of omission and the use of imposed times and costs.
Micro estimating methods are usually more accurate than macro methods.