


The Risk Identification Process produces a list of potential risks. Not all of these risks deserve attention. Some are trivial and can be ignored, while others pose serious threats to the welfare of the project. Managers have to develop methods for sifting through the list of risks, eliminating inconsequential or redundant ones and stratifying worthy ones in terms of importance and need for attention, this is called risk assessment. Let’s take a look at what that implies.
Risk Assessment Tools
Scenario analysis is the easiest and most commonly used technique for analyzing risks. Team members assess the significance of each risk event in terms of:
- Probability of the event.
- Impact of the event.
Simply stated, risks need to be evaluated in terms of the likelihood the event is going to occur and the impact or consequences of its occurrence.
The risk a project manager being struck by lightning at a work site would have major negative impact on the project, but the likelihood is so low it is not worthy of consideration.
Conversely, people do change jobs, so an event like the loss of key project personnel would have not only an adverse impact but also a high likelihood of occurring in some organizations. If so, then it would be wise for that organization to be proactive and mitigate this risk by developing incentive schemes for retaining specialists and/or engaging in cross-training to reduce the impact of turnover.
Defining the Risk Assessment Process
The quality and credibility of the risk assessment process requires that different levels of risk probabilities and impacts be defined. These definitions vary and should be tailored to the specific nature and needs of the project.
For example, a relatively simple scale ranging from “very unlikely” to “almost certainly” may suffice for one project. Whereas another project may use more precise numerical probabilities (e.g., 0.1, 0.3, 0.5)
Impact scales can be a bit more problematic since adverse risks affect project objectives differently.
For example, a component failure may cause only a slight delay in project schedule but a major increase in project cost. If controlling cost is a high priority, then the impact would be severe. If, on the other hand, time is more critical than cost, then the impact would be minor.
Because impact ultimately needs to be assessed in terms of project priorities, different kinds of impact scales are used.
- Some scales may simply use rank-order descriptors, such as “low,” “moderate,” “high,” and “very high”.
- Others use numeric weights (e.g., 1—10).
- Some may focus on the project in general while others focus on specific project objectives.
The risk management team needs to establish up front what distinguishes a 1 from a 3 or “moderate” impact from ‘severe” impact. The figure below provides an example of how impact scales could be defined given the project objectives of cost, time, scope, and quality.

Documentation of scenario analysis can be seen in various risk assessment forms used by companies. The figure below is a partial example of a risk assessment form used on an IS project involving the upgrade from Windows Vista to Windows 7.
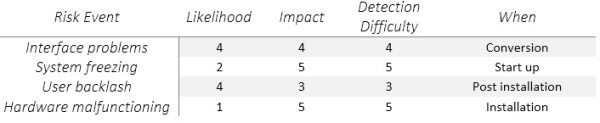
Notice that in addition to evaluating the severity and probability of risk events the team also assesses when the event might occur and its detection difficulty.
Detection difficulty is a measure of how easy it would be to detect that the event was going to occur in time to take mitigating action, that is, how much warning would we have?
So in the Windows 7 conversion example, the risk detection scale would range from 5= no warning to 1= lots of time to react.
Often organizations find it useful to categorize the severity of different risks into some form of risk assessment matrix. The matrix is typically structured around the impact and likelihood of the risk event.
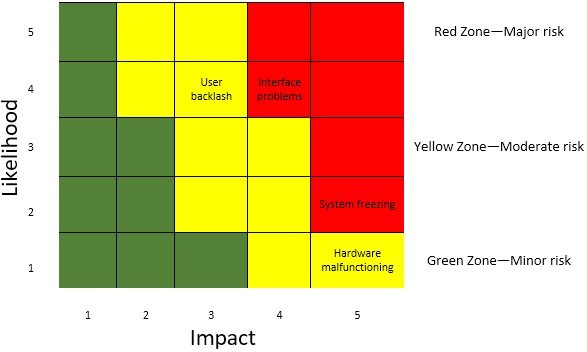
For example, the risk assessment matrix presented above consists or a 5 X 5 array of elements with each representing a different set of impact and likelihood values. The matrix is divided into red, yellow, and green zones representing major, moderate, and minor risks, respectively.
The red zone is centered on the top right corner of the matrix (high impact/high likelihood), while the green zone is centered on the bottom left corner (low impact/low likelihood). The moderate risk, yellow zone extends down the middle of the matrix.
Since impact is generally considered more important than likelihood (a 10 percent chance of losing $1 million is usually considered a more severe risk than a 90 percent chance of losing $1,000), the red zone (major risk) extends farther down the high impact column.
Using the Windows 7 project again as an example, interface problems and system freezing would be placed in the red zone (major risk), while user backlash and hardware malfunctioning would be placed in the yellow zone (moderate risk).
The risk assessment severity matrix provides a basis for prioritizing which risks to address. Red zone risks receive first priority followed by yellow zone risks. Green zone risks are typically considered inconsequential and ignored unless their status changes.
Failure Mode and Effects Analysis (FMEA) extends the risk severity including ease of detection in the equation:
Impact x Probability X Detection Risk Value = Risk Value
Each of the three dimensions is rated according to a five-point scale. For detection is defined as the ability of the project team to discern that the risk is imminent. A score of 1 would be given if even a chimpanzee could spot the risk coming.
The highest detection score of 5 would be given to events that could be discovered after it is too late (i.e., system freezing). Similar anchored scales would be applied for severity of impact and the probability of the event occurring. The weighting of the risks is then based on their overall score.
For example, a risk with an impact in the “1” zone with a very low probability and an easy detection score might score a 1 (1 x 1 x 1 = 1 ). Conversely, a high-impact risk with a high probability and impossible to detect would score 125 (5 x 5 x 5 = 125). This broad range of numerical scores allows for easy stratification of risk according to overall significance.
No assessment scheme is absolutely foolproof.
For example, the weakness of the FMEA approach is that a risk event rated Impact =1, Probability = 5, and Detection= 5 would receive the same weighted score as an event rated Impact =5, Probability =5, and Detection =1!
This underscores the importance of not treating risk assessment as simply an exercise in mathematics. There is no substitute for thoughtful discussion of key risk events.
As a recommendation for further reading you can take a look at this article: Probability Analysis, which extends the discussion about risk assessment methods.
If you like to continue reading about the Risk Management Framework here is the next article in the series: Risk Management Framework: Risk Response Development. You can always go back to the contents page and continue from there: Risk Management Guide.

