This is the second part of a short series on how to construct a project cost duration graph. You can find the previous part here.
There are three major steps required to start building a project cost duration graph:
- Find total direct costs for selected project durations.
- Find total indirect costs for selected project durations.
- Sum direct and indirect costs for these selected durations.
The graph is then used to compare additional cost alternatives for benefits. Details of these steps are presented here.
Determining the Activities to Shorten
The most difficult task in constructing a project cost duration graph is finding the total direct costs for specific project durations over a relevant range. The central concern is to decide which activities to shorten and how far to carry the shortening process.
Basically, managers need to look for critical activities that can be shortened with the smallest increase in cost per unit of time. The rationale for selecting critical activities depends on identifying the activity’s normal and crash times and corresponding costs. Normal time for an activity represents low-cost, realistic, efficient methods for completing the activity under normal conditions.
Shortening an activity is called crashing. The shortest possible time an activity can realistically be completed in is called its crash time. The direct cost for completing an activity in its crash time is called crash cost. Both normal and crash times and costs are collected from personnel most familiar with completing the activity.
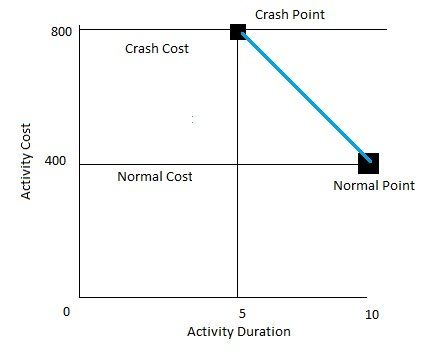
The figure above depicts a hypothetical project cost duration graph for an activity.
The normal time for the activity is 10 time units, and the corresponding cost is $400. The crash time for the activity is five time units and $800. The intersection of the normal time and cost represents the original low-cost, early-start schedule.
The crash point represents the maximum time an activity can be compressed. The heavy line connecting the normal and crash points represents the slope, which assumes the cost of reducing the time of the activity is constant per unit of time.
Assumptions made with this project cost duration graph are as follows:
- The cost-time relationship is linear.
- Normal time assumes low-cost, efficient methods to complete the activity.
- Crash time represents a limit—the greatest time reduction possible under realistic conditions.
- Slope represents cost per unit of time.
- All accelerations must occur within the normal and crash times.
Knowing the slope of activities allows managers to compare which critical activities to shorten. The less steep the cost slope of an activity, the less it costs to shorten one time period; a steeper slope means it will cost more to shorten one time unit. The cost per unit of time or slope for any activity is computed by the following equation:
In the figure above the rise is the y axis (cost) and the run is the x axis (duration). The slope of the cost line is $80 for each time unit the activity is reduced; the limit reduction of the activity time is five time units. Comparison of the slopes of all critical activities allows us to determine which activity(ies) to shorten to minimize total direct cost.
Given the preliminary project schedule (or one in progress) with all activities set to their early-start times, the process of searching critical activities as candidates for reduction can begin. The total direct cost for each specific pressed project duration must be found.
We hope you enjoyed the article. You can find the next and final part here.
Image courtesy of Freepik.